Product
geoLOGr
Combining the benefits of point and imaging systems, the geoLOGr hyperspectral rock analyzer collects up to 1000 high-quality spectra per meter, plus drill core photographs with a 35 μm per pixel resolution. The collected data volumes are optimized for fast processing and cost-efficient data storage and archiving.
Key Features
The geoLOGr hyperspectral rock analyzer consists of an extendable and height-adjustable, wheel-based metal frame that carries a movable sensor head that contains a hyperspectral point sensor and a high-resolution linescan camera. The sensor head moves at a constant speed over the entire length of the drill core, collecting data in a continuous and non-destructive manner. The geoLOGr’s flexible design allows it to be deployed on the ground, on a tabletop, or above a roller table. It takes only one day of remote training for an operator to start scanning with the geoLOGr.
Industrial-Grade Adjustable Frame
- Adjustable height
- Adjustable length (for drill core up to 1.5 m/5 ft)
Deployment Options
- Ground
- Tabletop
- Roller Table
Size (L x W x H)
- collapsed: 155 x 60 x 55 cm
- extended: 225 x 60 x 120 cm
Weight: 55 kg
Electrical Power
- 120-240V
- CSA and CE compliant
SWIR Spectrometer
- 900-2500 nm range
- Bi-directional reflectance
- 512 spectral channels
- 3.1 nm band spacing
High-Resolution Digital Linescan Camera
- 35 μm per pixel (20 μm per pixel optional)
Multiple Light Sources
- Halogen and LED


Scanning
- Core is scanned row-by-row
- High scanning capacity
- ~350 m of drill core in 8-hours
- ≅ 10,000 m per month
- ≅ 120,000 m per year
- High frequency spectral readings
- Up to 1000 spectra per meter
- 1 mm minimum measurement spacing
- 10 mm spot size
- High resolution photography
- Continuous core photos
- Data is uploaded to secure cloud-based storage for processing, analysis and interpretation
- Raw data and outputs are fully owned by the customer
Data Analysis and Outputs
Since hyperspectral data are not directly usable in their raw format, it is the data processing that ultimately determines the quality and value that can be derived from the hyperspectral data.
The geoLOGr is accompanied by world-leading, cloud-based data processing that is customized for each deposit. We use a range of processing tools that were developed in-house by our highly experienced team to analyze and interpret the hyperspectral data collected by the geoLOGr.
Easy workflow integration
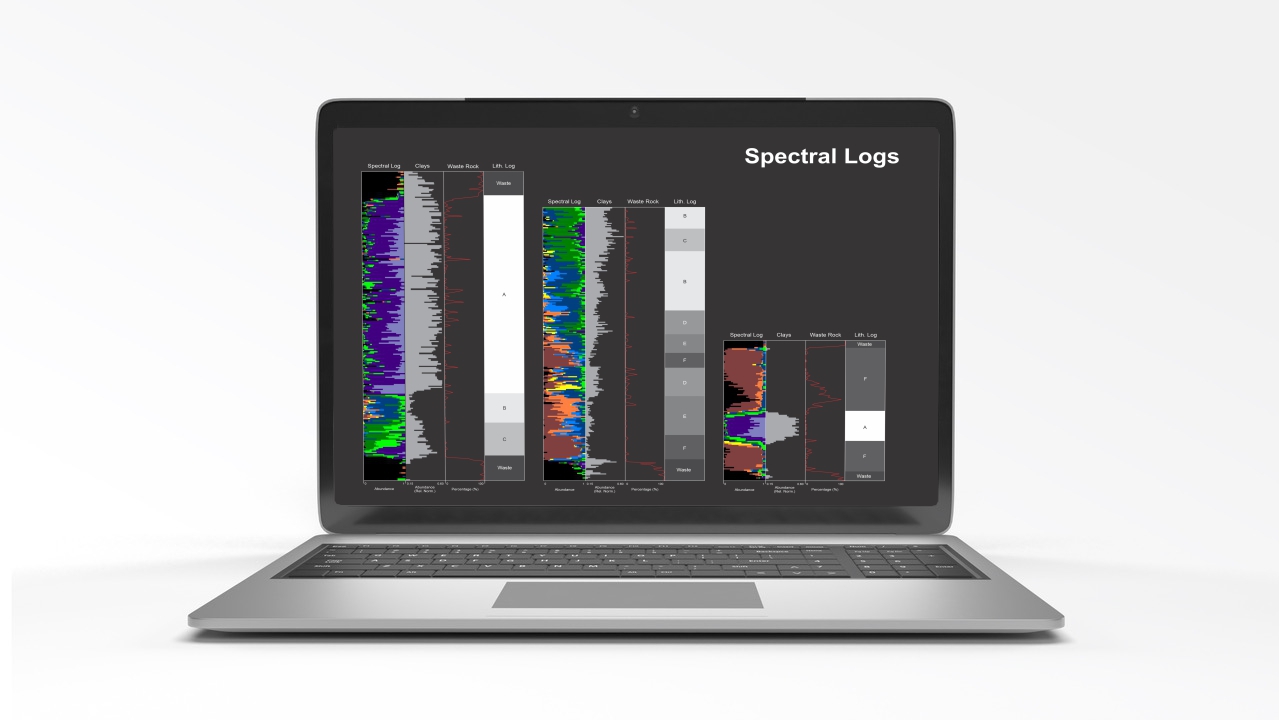
Each project includes an onboarding phase, in which the geoLOGr results are validated and customized for easy workflow integration. Outputs usually consist of detailed logs that provide continuous compositional information at high spatial resolution. However, format and content of the outputs can be adjusted to each customer’s specific requirements.
Introducing the LithotypeTM
Our hyperspectral data analysis is unique and focuses on the accurate identification of spectrally distinct mineral assemblages or rock types, which we simply refer to as LithotypeTM. This multidimensional analysis approach condenses traditional single vector results, such as band ratios and band positions, into a single reliable output. It also eliminates the need for spectrally-derived single mineral abundance estimates, which tend to have low accuracy.
As a result, the geoLOGr produces rock identification with the highest sensitivity and accuracy possible.
The geoLOGr also produces
- Ore dilution logs
- Predictive geochemical logs
- Predictive petrophysical and geometallurgical logs (hardness, grindability, density, floatability)
- Deleterious minerals logs
- Total Bitumen Content (TBC)
The geoLOGr provides the flexibility to quickly adjust to the demands, expectations, and interests of customers, which may change during the course of a project.

Order your geoLOGr Today!
Please get in touch with us to learn more about our product and how it can help you!